Solution of quadratic equation by graphical method
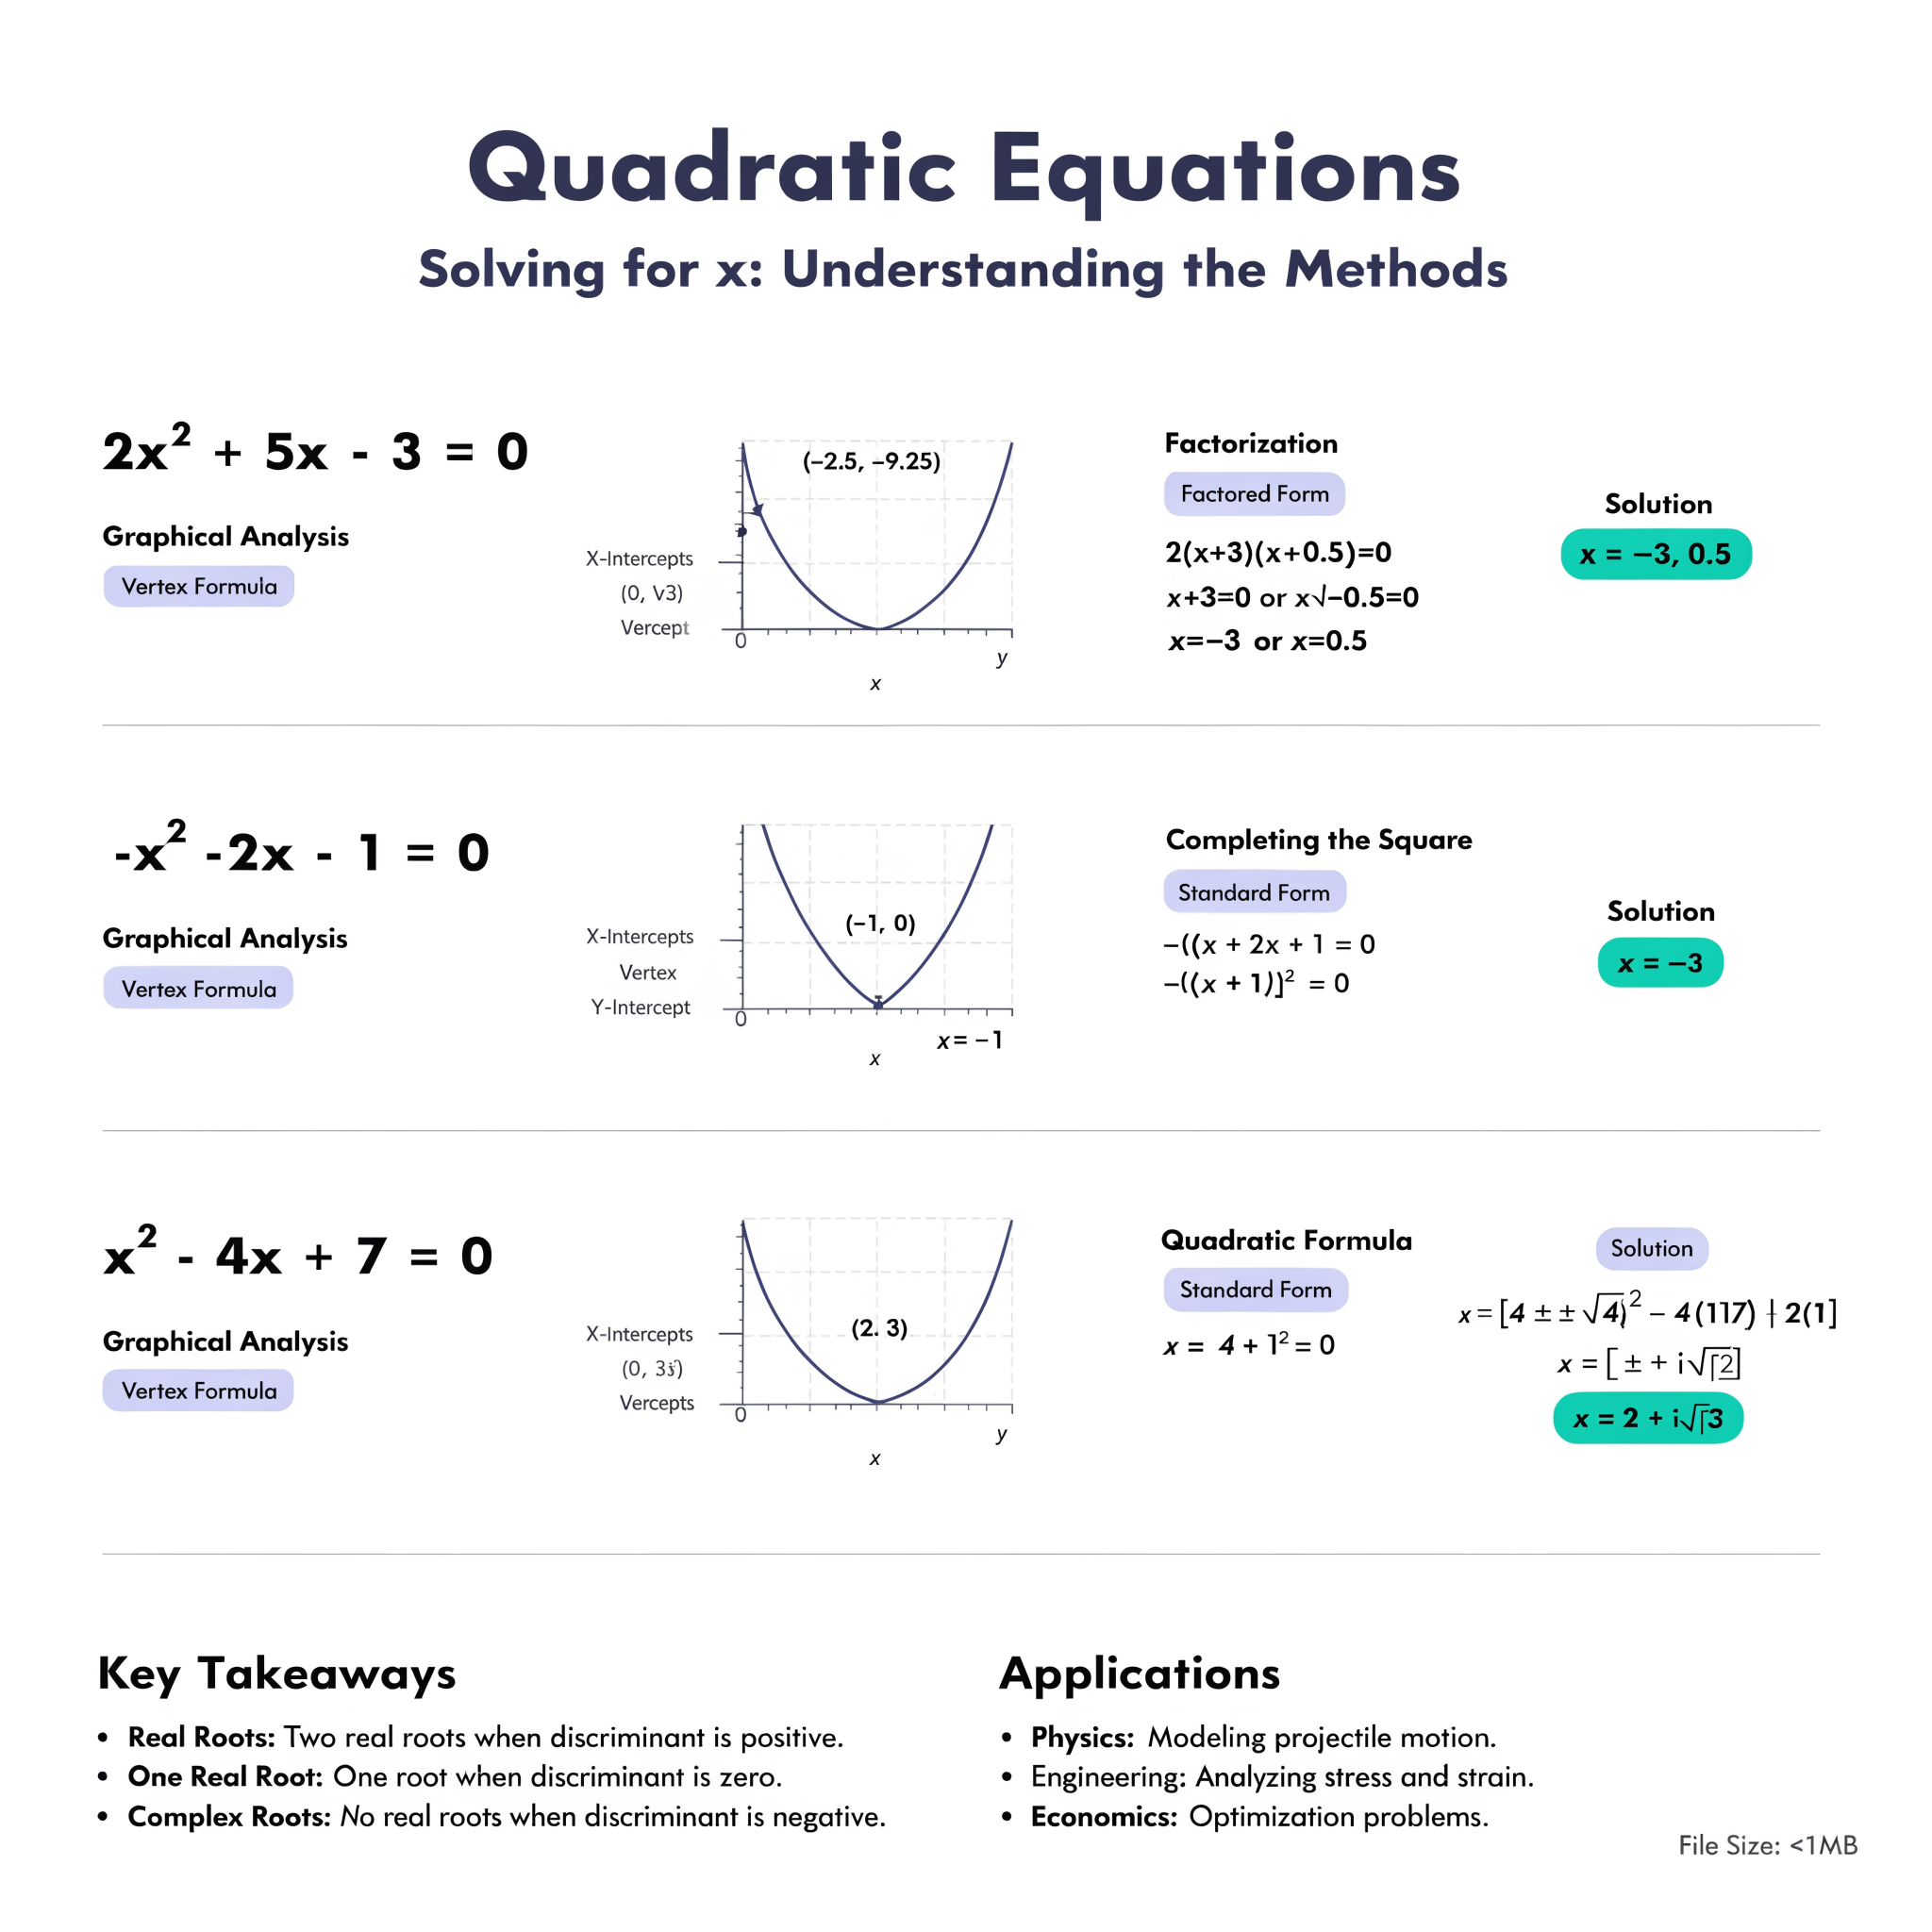
📐Solving Quadratic Equations by Graphical Method
Updated & expanded with clear explanations & illustrations
📌 Content
- Reading the roots from the graph
- Determination of minimum and maximum values
- Line of symmetry
- Finding equation from a given graph
📝 Introduction
A quadratic equation is typically written as ax² + bx + c = 0. The graphical method involves plotting y = ax² + bx + c and interpreting its shape to find solutions (roots), turning points, and symmetry.
📋 Steps for solving quadratic equations graphically
- Determine the range of x – use the given range or choose a suitable one (e.g., –3 to 5).
- Calculate corresponding y values – substitute each x into the equation, make a table of (x, y).
- Choose a suitable scale – e.g., 2 cm = 1 unit on x‑axis, 1 cm = 5 units on y‑axis.
- Draw axes and plot points – mark scales accurately.
- Join points smoothly – use a flexible curve; the graph is always a smooth parabola (never straight lines).
✏️ Note 2: If coefficient of x² is positive → parabola opens upward (V‑shape) → has a minimum value.
If coefficient of x² is negative → parabola opens downward (∩‑shape) → has a maximum value.
✏️ Note 3: The line of symmetry is the vertical line that divides the parabola into two mirror halves. Its equation is x = –b/(2a).
📈 Possible positions relative to the x‑axis
(a) Two distinct real roots – curve crosses x‑axis at two points.
(b) One repeated (double) root – curve touches x‑axis at vertex.
(c) No real roots (imaginary) – curve does not meet x‑axis.
📘 Worked examples
Example 1 – Maximum value & two distinct roots
Problem: Draw the graph of y = 11 + 8x – 2x² from x = –2 to x = 6. Hence find approximate roots of 2x² – 8x – 11 = 0 and the maximum value of y.
Table of values:
| x | –2 | –1 | 0 | 1 | 2 | 3 | 4 | 5 | 6 |
|---|---|---|---|---|---|---|---|---|---|
| y | –13 | 1 | 11 | 17 | 19 | 17 | 11 | 1 | –13 |
🔹 Scale: x‑axis 2 cm = 1 unit, y‑axis 1 cm = 5 units
Interpretation:
- Roots (where y = 0): approximately x = –1.1 and x = 5.1.
- Maximum value of y = 19 (at x = 2).
Example 2 – Minimum value & repeated root
Problem: Given y = 4x² – 12x + 9 , complete the table and draw the graph. Find the roots, minimum y and line of symmetry.
| x | –1 | 0 | 1 | 2 | 3 | 4 |
|---|---|---|---|---|---|---|
| 4x² | 4 | 0 | 4 | 16 | 36 | 64 |
| –12x | 12 | 0 | –12 | –24 | –36 | –48 |
| +9 | 9 | 9 | 9 | 9 | 9 | 9 |
| y | 25 | 9 | 1 | 1 | 9 | 25 |
🔹 Scale: x‑axis 2 cm = 1 unit, y‑axis 1 cm = 5 units
- Roots: the curve touches the x‑axis at x = 1.5 (repeated root).
- Minimum value of y = 0.
- Line of symmetry: x = 1.5.
🔍 Finding equation from a given graph
General rule: If a parabola cuts the x‑axis at x = a and x = b, the factors are (x – a)(x – b) = 0. If it touches at x = a (double root), then (x – a)² = 0. Always check the y‑intercept (constant term) to adjust the equation.
Example A
Curve cuts x‑axis at x = –2 and x = ½ ; y‑intercept = –2.
→ (x + 2)(x – ½) = x² + ³⁄₂x – 1 = 0. Multiply by 2 to get constant –2: 2x² + 3x – 2 = 0.
Example B
Curve touches x‑axis at x = –4 (double root); y‑intercept = –16.
→ (x + 4)² = x² + 8x + 16 = 0. Multiply by –1 to get constant –16: –x² – 8x – 16 = 0.
🧪 Evaluation – practice problems
- (a) Using a suitable scale, draw graph of y = x² – 2x from x = –2 to x = 4.
(b) Find approximate roots of x² – 2x = 0.
(c) What is the minimum value of y?
(d) Find x when y = 7. - (a) Draw graph of y = x² + 2x – 2 from x = –4 to x = 2.
(b) Hence find roots of x² + 2x – 2 = 0. - Find equation of a curve that cuts x‑axis at –3 and 1, with y‑intercept 6.
📅 Weekend assignment
(Use the graph described: parabola opening upward, crossing x‑axis at –2 and 2, y‑intercept –4)
- Find the equation of the graph.
- What are the roots?
- What is the minimum value of y?
- Find x when y = 3.
- Find y when x = 1.5.
📖 Theory question
- (a) Prepare a table for y = x² + 3x – 4 from x = –6 to x = 3.
- (b) Draw the graph (scale 1 cm = 1 unit on both axes).
- (c) Find the least value of y.
- (d) Find the roots of x² + 3x – 4 = 0.
- (e) Find x when y = 1.
📚 Reading assignment
New General Mathematics for SS 1, pages 69–74, by M.F. Macrae et al.
Test yourself on Mathematics
Track your reading & take quizzes
Create free account